Application Note AN-C01
Instruments to which this note applies: I-Cal 4000, I-Cal 8000, I-Cal 2000 HPC, I-Cal 4000 HPC, I-Cal 8000 HPC
Target use: Quality Control at the Cement plant and the concrete producer level. Concrete mix design
Introduction
Sulfate is added to Portland Cement to control the early aluminate reaction during cement hydration. Most standards prescribe sulfate optimization only at room temperature and in absence of Supplementary Cementitious Materials (SCM) or chemical admixture, both of which are well known to affect the sulfate balance of any given cement. This application note describes a simple approach to gauge and optimize the added sulfate level in Portland cement based on original work by Lerch [1].
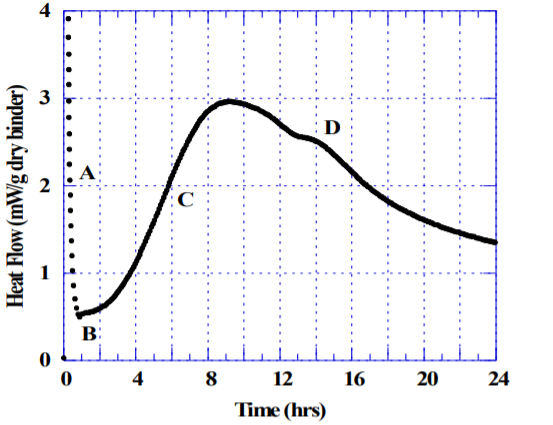
Figure 1 shows an example of hydrating Portland cement in the absence of admixture, a water-to-cement ratio of 0.45, tested at 23 C by an isothermal conduction calorimeter. Portland cement mixed with water initially displays a strong exotherm (A) caused by rapid dissolution and initial hydration of mainly the aluminate phase. If sufficient sulfate is available in solution, the hydration rate rapidly decreases (B) as aluminate reacts with calcium and sulfate to form ettringite-like phases. After some time the strength generating alite hydration takes off, which results in a broad exotherm (C). Time of set depends on the concrete mixture design, particularly the water-cement ratio and type of cement, but normally occurs at the early stages of the broad exotherm (C). The alite and aluminate hydration continue in parallel until the mixture runs out of sulfate in the pore solution, indicated by the “sulfate depletion” peak (D). The sulfate depletion peak is a very useful indicator for a portland cement producer when optimizing the amount and types of sulfate added to the cement. In a well-balanced cement, the sulfate depletion peak normally occurs several hours after the maximum of the main hydration peak as shown in Figure 1. The fact that the sulfate depletion peak appears well after the maximum indicates that the cement tested has an adequate buffer of soluble sulfate that will greatly reduce the risk for a concrete mixture of the same cement with admixtures and Supplementary Cementitious Materials (SCM’s) to become undersulfated. ASTM C1679 offers a more detailed discussion on the significance of the sulfate depletion peak and how to test for it using isothermal calorimetry.
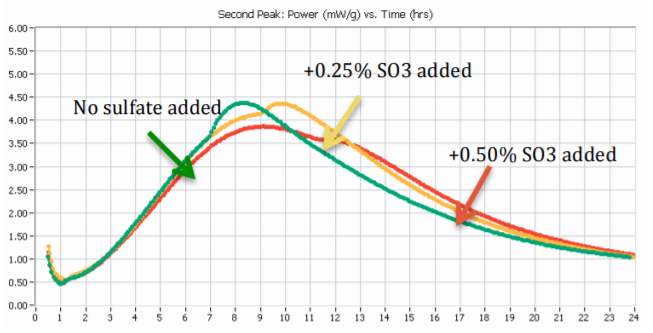
Calorimetry offers a quick and practical way to test sulfate imbalance, either to spot chronically undersulfated cement sources, or to understand the limits of additive addition before facing performance problems. See Application Note AN-C02 for details on how to test for sulfate balance in presence of admixture and/or SCM. A power curve will for most Portland cements show a second peak of hydration indicative of the extent excess sulfate has been consumed in the early C3A reaction, making calorimetry a convenient tool to quickly assess and solve issues of sulfate imbalance. Figure 2 shows how one can optimize the sulfate content of a Portland cement using heat flow curves from isothermal calorimetry. Beginning with an industrial cement sample or a laboratory manufactured cement sample with a known, below-optimum SO3 content, simply mix the Portland cement sample with water and test the cement paste in the calorimeter [2]. Then prepare replicate samples of cement paste, adding incremental doses of the target sulfate source to the sample prior to mixing it with water. Figure 2 shows an example of this procedure for a Portland cement with incremental additions of sulfate to a Portland cement with an SO3 content below optimum.
Note:
1) The sulfate depletion point (D in Figure 1) should for a well balanced cement occur several hours after the main peak (C in Figure 1).
2) Cement plants typically add sulfate as gypsum (calcium sulfate dihydrate) to the cement mill. Parts of the gypsum dehydrates in the mill to form calcium sulfate hemihydrate, which dissolves faster and has a higher solubility than gypsum.
3) Different sources of sulfate have different solubility and efficiency as a controller of the cement aluminate hydration. If the cement is very reactive it is often desirable to use hemihydrate to control the very early part of the hydration (A in Figure 1), although an excess of hemihydrate may cause undesirable precipitation of gypsum (so called “false set”). Since false set is not easily detectable by calorimetry, it is important to perform workability tests in parallel with calorimetry.
4) Laboratory samples often perform very different from industrial samples. It is recommended to use industrial samples whenever possible for sulfate optimization tests. Interground sulfate typically dissolves faster and is more effective compared to admixed sulfate. Hence, less sulfate is typically needed for optimum balance when added to the cement mill, compared to when admixed in the laboratory.
5) The very early hydration (A in Figure 1) is critical for slump life. A very reactive cement can suffer from loss of workability due to inadequate supply of dissolved sulfate for proper aluminate control at early age, while still having a sulfate depletion peak well after the main hydration peak as in Figure 1. One can use calorimetry to probe the effect of sulfate additions at very early age by preconditioning the mix water to exactly the same temperature as the calorimeter prior to mixing, Please refer to the Calmetrix Video tutorial on Cement paste testing for an overview of the proper water conditioning procedure. This tutorial can be found in the Support section on the Calmetrix website.
Test Protocol – “sulfate depletion” peak
1. Set the calorimeter at the desired test temperature and wait for at least 16h for the calorimeter to stabilize to isothermal conditions.
2. Select a parent industrial cement sample with less than optimum sulfate.
3. Weigh 50.0 g cement in each sample cup with incrementally higher additions of the sulfate source of interest to the cement. (For example add 0, 0.25%, 0.50%, 0.75%, 1.0% sulfate measured as % SO3 by weight of cement.)
4. Weigh out 25 g of mix water in separate sample cups an place in the corresponding calorimetry cells for conditioning to the desired temperature. Start logging and wait for the heat flow to stabilize at or very close to zero, at which point the mix water has reached the desired temperature. Stop logging data, configure each cell for cement paste testing.
5. For each cell remove the water from the calorimeter and immediately add the water to the corresponding cement sample and mix for 30s, then place the cement paste sample in the calorimeter and start logging. Continue to log data for at least 4 h beyond the “sulfate depletion” peak.
Results – “sulfate depletion” peak
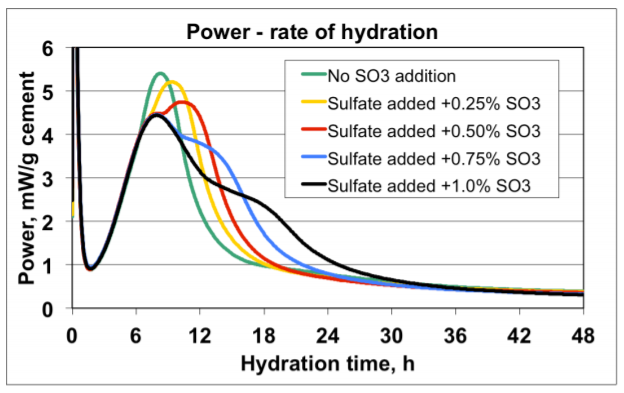
Figure 3 shows an example of results from sulfate addition tests to a high C3A cement tested at 20°C.
Interpretation
A) The “sulfate depletion” peak was not visible in the sample without sulfate addition to the parent cement; however the sulfate depletion peak became easily visible at 0.50% SO3 addition and higher sulfate dosages.
B) The cement tested would need approx. 0.75% to 1.0% sulfate measured as SO3 by weight of cement to reach sulfate optimum according to Lerch.
Test Protocol – very early age hydration
The following protocol is suitable for testing of the effect of sulfate additions to a cement that is suspected of insufficient supply of soluble sulfate for early aluminate control
1. Set the calorimeter at the desired test temperature as close as possible to ambient temperature and wait for at least 16h for the calorimeter to stabilize.
2. Select a parent industrial cement sample with less than optimum sulfate.
3. Weigh 10.0 g cement in each sample cup with incrementally higher additions of the sulfate source of interest to the cement. (For example add 0, 0.25%, 0.50%, 0.75% calcium sulfate hemihydrate measured as % SO3 by weight of cement.)
4. Weight out 5.0 g of mix water in separate sample cups and place in the corresponding calorimetry cells. Start logging and wait for the heat flow to stabilize at or very close to zero, at which point the mix water has reached the desired temperature. Stop logging data, then configure each cell for cement paste testing.
5. For each cell remove the water from the calorimeter and immediately add the water to the corresponding cement sample and mix for 30s, then place the cement paste sample in the calorimeter and start logging. Continue to log data for at least 1 h.
6. Prepare mortar samples using the same cement and sulfate additions as in step #3 using a suitable mortar method such as ASTM C359. Alternatively, prepare cement paste samples using the same cement and sulfate additions as in step #3 using a suitable cement paste method such as ASTM C451.
Results – very early age hydration
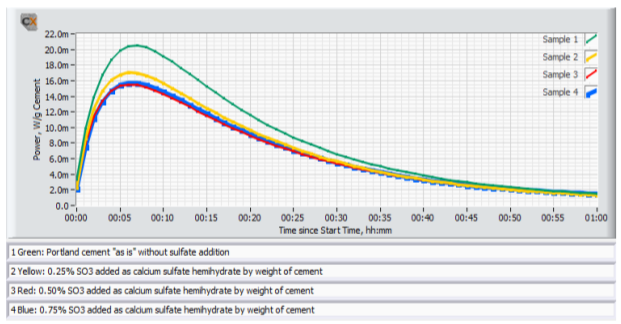
Figure 4 shows an example of early age calorimetry results from sulfate addition tests to a high C3A cement tested at 20°C. Figure 5 shows an example of results from corresponding ASTM C 359 mortar tests.
Interpretation
A) The mix without sulfate addition displayed the highest activity by calorimetry immediately after mixing, and also suffered from rapid loss of workability in the ASTM C359 mortar tests. This is a clear indication of a cement suffering from insufficient amount of sulfate in solution to control the aluminate hydration.
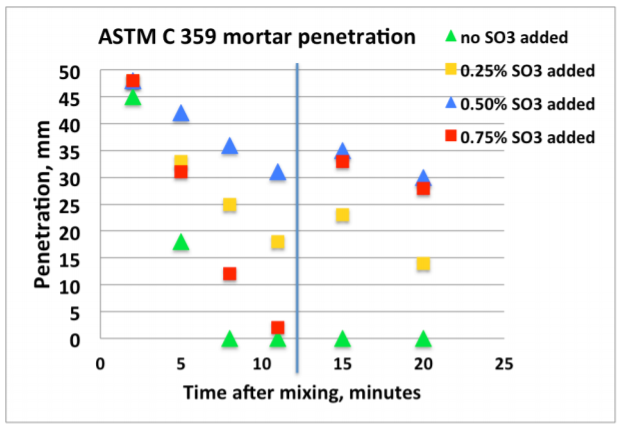
B) Addition of 0.25% SO3 as calcium sulfate hemihydrate significantly reduced the activity immediately after mixing, and also significantly improved the mortar workability.
C) Addition of another 0.25% SO3 (total addition 0.50%) as calcium sulfate hemihydrate only marginally reduced the activity further. However, the workability was again further improved.
D) Yet another addition of 0.25% SO3 (total addition 0.75%) as calcium sulfate hemihydrate did not reduce the activity further. On the other hand, the workability was drastically reduced but recovered after the re-mix 12 minutes after the initial mix time. This behavior is a classic sign for gypsum precipitation, so called “false set” due to excess soluble sulfate relative to the aluminate activity.
E) Based on the results the optimum SO3 addition with respect to early workability is approx. 0.5% SO3 as calcium sulfate hemihydrate.
Conclusion
Calorimetry is a very useful technique for sulfate optimization of cement, either alone or in combination with other methods. See also Application note AN-C02 regarding sulfate optimization in presence of Supplementary Cementitious Materials and chemical admixtures.
References
1. Lerch, William. ”The influence of gypsum on the hydration and properties of Portland cement pastes”, Proceedings, Vol. 46, of the American Society for Testing Materials, 1946.
