Instruments to which this note applies: Biocal 2000, Biocal 4000
Prepared by: Lars Wadsö
Target use: Microbiological studies, detection of microbial activity, testing the effectiveness of microbicides.
Important Notes:
- This document is a draft and a work in progress. Do not distribute.
- The data presented at the end of this note is from preliminary measurements by Melvin Pascall and Jaesung Lee at the Food Innovation Center, Ohio State University, USA comparing E. coli and Listeria innocua plate count data to calorimetry. A Calmetrix Biocal 2000 isothermal calorimeter was used for all calorimetric measurements.
About plate counts
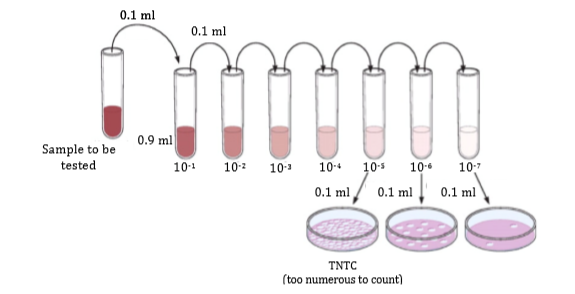
Microbial plate counts is a method to assess the number of viable organisms in a sample by counting the number of organisms that grow (i.e. that form colonies) on a nutritious agar plate. As the number of organisms per unit volume is usually unknown, a series of dilutions are made and plated on separate agar plates. Only the plate on which it is easy to count the number of organisms is used. The number of organisms counted are converted from organisms per unit area to organisms per unit volume, called CFU (colony forming units, typically per ml). The procedure is described in Fig. 1.
Isothermal calorimetry
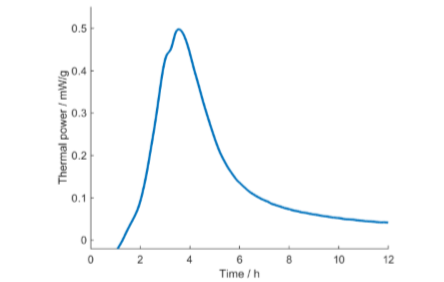
An isothermal calorimeter measures the heat production rate from a 1-100 ml sample directly and continuously, a significant advantage over traditional techniques. As heat production is a common phenomenon, calorimetry can be used for different purposes in many different fields of science and technology. In this note, we will limit ourselves to the measurement of microbial growth, i.e., at the start of a test we have a substrate (medium) with a few microorganisms whose growth we want to follow. For such a measurement, almost any substrate and any microorganism (or more than one organism) can be used, and measurements can in principle be made both on agar and using real substrates, such as foodstuffs. A simple example of a microbiological measurement with an isothermal calorimeter is the study of milk fermentation, where vials with milk are inoculated by 1% of the fermented product (containing bacteria) and placed in the calorimeter. The curves in Figs. 2-3 represent the result from such a measurement of yogurt fermentation at 37 °C in a Biocal 2000.
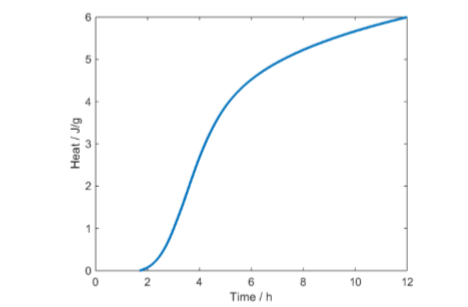
The primary result of such a test is the curve in Fig. 2: the thermal power (heat production rate) as a function of time. The curve in Fig. 3 is the integrated thermal power curve, or the heat, as a function of time. Both these representations can be used in the interpretation of results. The interpretation of isothermal calorimetric growth curves is discussed in more detail by Braissant et al. [1].
Isothermal calorimetry as a complement to plate counts
Plate counts can be used for many different types of studies and isothermal calorimetry can be a complement as it is a much less labor intensive and often faster method. However, isothermal calorimetry is not a replacement for plate counts, and the results will in many cases not be identical, as the two methods measure quite different parameters: plate counts assess the number of viable organisms in a sample (at a certain time), while calorimetry assesses the activity of these microorganisms by continuous measurement of the heat they produce.
As different microorganisms have different heat outputs per cell, isothermal calorimetry is not a general method to quantify the number of cells in a sample. A sample may also have been depleted of its nutrients and therefore produce negligible heat from the microorganisms in it. If the sample is out-plated on a nutritious agar, there will be quick 9growth. Similarly, there will be quick and generally measurable heat if the out-plated agar is placed in the calorimeter. This note lists some examples where isothermal calorimetry can complement plate counts.
Challenge tests
According to Curale and Vestergaard, “A microbial challenge study is used to simulate what happens to a product during processing, distribution and subsequent preparation and handling should it become contaminated. A properly carried out microbiological challenge study is performed by inoculating selected microorganisms into a food or formulation to determine if the organisms would present a potential health hazard or spoilage risk” [2].
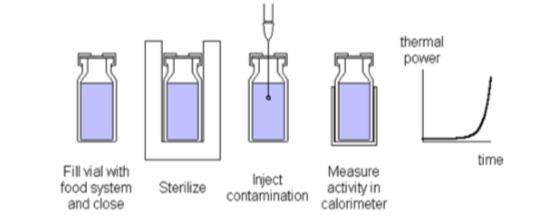
The normal way to do this is to inoculate a food/formulation, while keeping it at a temperature of interest, and taking samples for plate counts at regular time intervals. This is a rather labor intensive measurement as several replicates are needed for every dilution at every time point of analysis. In contrast, with isothermal calorimetry only one sample is needed and the result is directly available (not after the plate count procedure). Inoculation of calorimetric samples can be made as shown in Fig. 4. Note that the sterilization step is optional, depending on the nature of the food system and the objective of the test.
presence of microorganisms
Detecting the presence of microorganisms
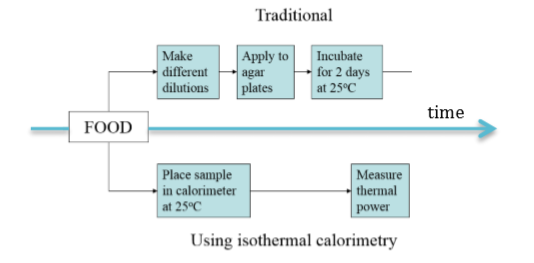
This application refers to detection of microbial activity in a nutritious substrate that is expected to be free of microorganisms, for example human samples (blood, urine), or a pasteurized/sterilized food-stuff. In these cases, isothermal calorimetry can be an effective alternative to plate counts. Instead of waiting for colonies to grow on agar plates, the sample is monitored in the calorimeter in real time. This is often faster than plate counts, since one can conclude as to the presence of microorganisms as soon as the onset of exponential growth is seen in the calorimetric curve.
The comparison between the traditional plate count approach and calorimetry is shown schematically in Fig. 5 below.
carrot juice. The thermal power is representative of
microbiological growth
Influence of additives
In industry and academia, it is common to assess the influence of a given additive on the activity of microorganisms. Typical examples of systems for which such studies are of interest are additions of preservatives to food-stuffs and additions of antimicrobial compounds to infectious bacteria. It is possible to do such studies using plate counts either by assessing the growth of microorganisms on plates with different concentrations of the additive, or by standard plate counting samples from cultures with different numbers of organisms.
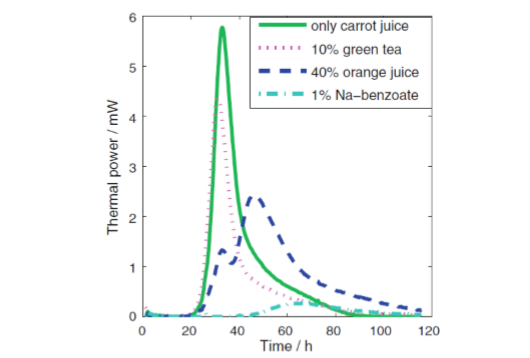
Isothermal calorimetry can directly measure growth curves, which makes it easy and convenient to assess the influence of additives. An example of this is shown in Fig. 6 below, where different additives were tested as possible preservatives of carrot juice.
Quantification of exponential growth curves
This application is similar to the first phase of the fermentation example in Figs. 2-3. With isothermal calorimetry, we take the inoculated sample and place it in the calorimeter; with plate counts we would inoculate a large sample and take sub-samples of this sample at different times, which would then be diluted, out-plated and placed in a thermostated cabinet. After a certain time the CFUs on each plate would then be counted. But if we are only interested in the maximum growth rate (i.e. parameters such as doubling time, time constant, etc.) we can also derive this information from the calorimetric results, by quantification of the densitiy of active microorganisms as detailed below.
Quantification of the density of active microorganisms
In this case, the use of calorimetry has a similar goal to the plate count technique: to determine the total number of organisms per unit volume. For plate counts this is assessed as colony forming units (CFUs), but for calorimetry I prefer to use the term “density of active microorganisms”, DAM. As was stated above, different microorganisms have different heat productions per cell, so it is not possible for calorimetry to be a general tool to measure DAM or CFU, but for cases where it is known how much heat each organism produces, isothermal calorimetry may complement plate counts. Examples of such cases could be fermentation processes (where one has added a single known culture organism) and medical applications where the identity of the infectious organisms is known.
102 CFU/ml dilution. (Plate counts)
Comparison between plate counts and isothermal calorimetry
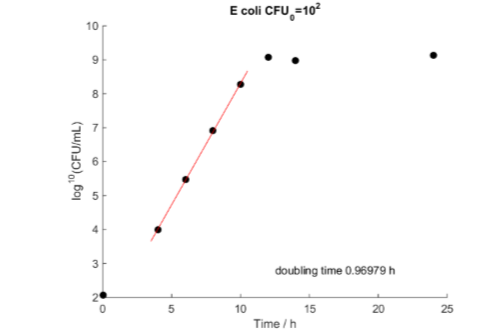
The data discussed in this note is from preliminary measurements by prof. Melvin Pascall and Jaesung Lee from the Food Innovation Center at Ohio State University, USA comparing E. coli and Listeria innocua plate count data to calorimetry. Two organisms (E. coli and Listeria innocua) were used to inoculate samples at three dilutions (101, 102 and 103 CFUs per ml). The growth was then followed using isothermal calorimetry (25 ml samples in a Calmetrix Biocal 2000 at 37 °C) and at regular times by taking samples for outplating and later plate counts. As an example of the primary conclusions, the results for E. coli at a dilution corresponding to 102 CFUs/ml are shown in Fig. 7.
Isothermal calorimetry
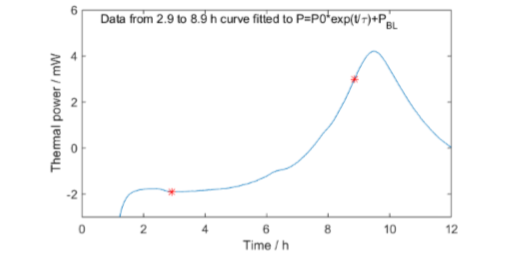
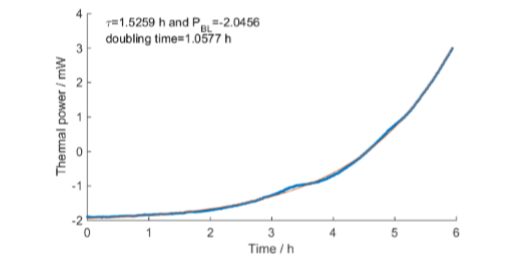
Fig. 8 shows the whole calorimetric measurement. Fig. 9 shows the exponential curve fit for the exponential growth part of the data (between the red stars in Fig. 8). The small peak on the exponential slope was visible in all calorimetric measurements.
Correlation
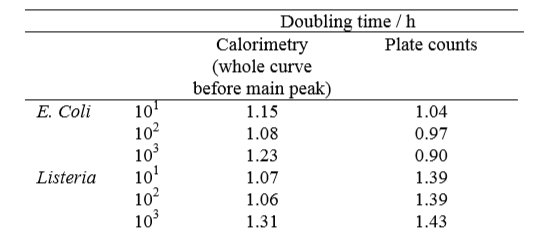
The doubling times were evaluated from both the plate counts and the isothermal calorimetry experiment, and are shown in Table 1 below.
The results show a good correlation, considering that the two methods assess different aspects of the microbial growth.
calorimetric curve
References
-
Braissant, O., et al., Microbial growth and isothermal microcalorimetry: growth models and their application to microcalorimetric data. Thermochim. Acta, 2013. 555: p. 64-71.
-
Curale, M.S. and E.M. Vestergaard, Do You Need Microbial Challenge Testing? . Food Safety Mag., 2001. April/May.
obtained by plate count an by isothermal calorimetry testing.
- Fig 6 - The effect of different additives on the preservation of carrot juice. The thermal power is representative of microbiological growth.png (58.69kB)
- Fig 2 - Thermal power curve.png (19.71kB)
- Table 1 - Doubling times of E. coli and Listeria innocua obtained by plate count an by isothermal calorimetry testing..png (24.08kB)
- Fig 8 - Calorimetric measurement of E. coli inoculation.png (22.96kB)
- Fig 4 - Test preparation of calormetric samples.png (25.29kB)
- Fig 9 - Exponential curve fit of the growth phase of the calorimetric curve.png (24.19kB)
- Fig 3 - Heat curve.png (17.08kB)
- Fig 1 - Serial dilution process for plate counts.png (71.88kB)
- Fig 5 - Traditional vs. calorimetric method to test for the presence of microorganisms.png (33.29kB)
- Fig 7 - Determination of doubling time by plate count.png (18.65kB)
