Not every supplier of thermoplastic materials - such as Nylon - test their final product before bagging it up and sending it of to the plastic processor. And even those that do test their product before shipping it can make mistakes.
The Confirmation mode of the identiPol QA2 system can be used to confirm that a fresh batch or delivery of material from your supplier can be processed without issue. This article sets out how the Confirmation mode may be used for the rapid assessment of Nylon (PA) material in a quality assurance procedure.
First the system “learns” the properties of good material - in this case PA - by measuring 10 to 20 batches of good material that have previously been processed without problems. These measurements are used to build a reference set against which future batches can be compared against.
The identiPol system uses the QIS as a measure of similarity between in-coming material and the reference set. A QIS of 10 would indicate that the samples are totally identical and a value of 0 would mean they are completely different. In practice, values between 7 and 10 are perfectly acceptable in order to have confidence that the material may be put onto the producon line with confidence. The simplicity of using the QIS value as a measure of PASS (7 or over) or FAIL (less than 7) cannot be over emphasised as it enables new, inexperienced or non- technical staff to quickly make a judgement prior to putting material into the manufacturing process.
Test samples are prepared by moulding a couple of plasc granules within the idenPol QA2 to give a consistent material for measurement. This is then followed by a second heating regime to measure the properties of the new batch of material.
A sample score between 4 and below 7, would usually indicate it is very similar, but a key property (e.g. a lower softening temperature) is different. Contamination is one reason why a QIS value could drop below 7. If there is contamination in sufficient quanty to affect the QIS, then it will almost certainly affect either processing or product properties.
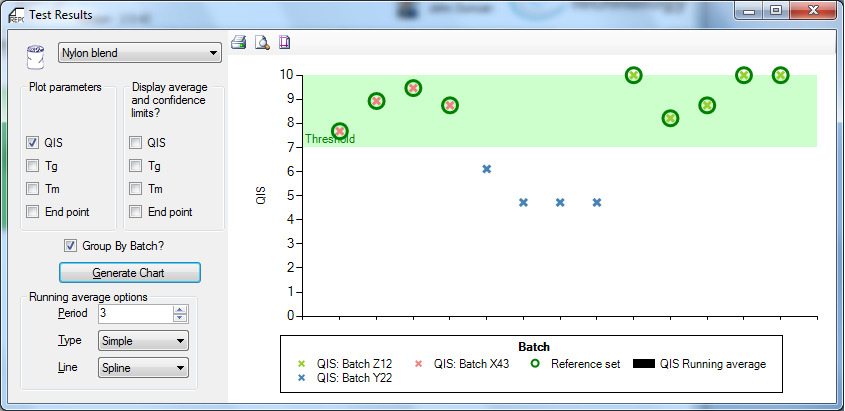
In the example above the QIS value is shown for various batches of Nylon (Z12, Y22 & X43). The green band at the top of the graph is the “Pass Region” and results falling in this zone are acceptable and the material can be processed.
Clearly batches Z12 and X43 are acceptable as all of the results fall within the “Pass Region” and so this material may be passed onto the production line without problems.
Any results falling in the white area below the green band fall in the “Fail Region” and this material should be rejected and not used in production. Batch Y22 is in this region and has a QIS value significantly below 7. So, this material would be unsuitable to pass onto the production line and the quality of the material should be questioned with the supplier. If this material were processed it would produce an item with significantly different mechanical properties and be rejected by the final customer.
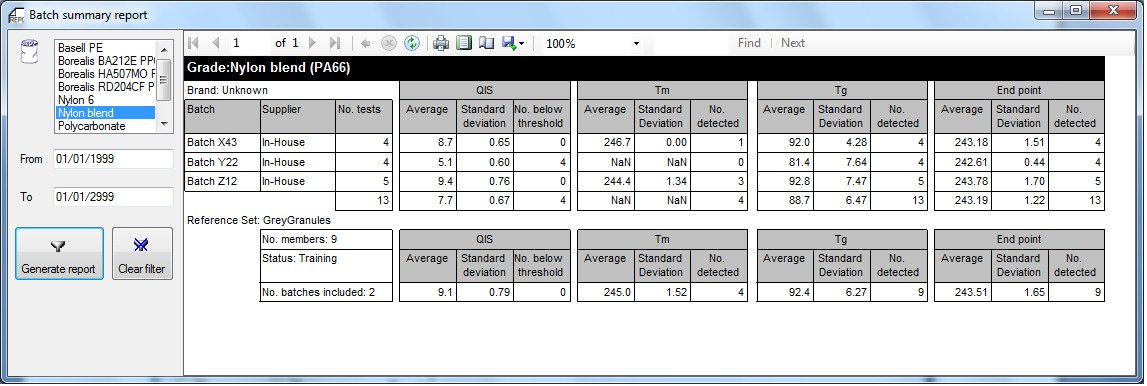
The Batch Summary Report below, details the key properties for each batch. Aside from the Pass / Fail QIS value, the report also includes results for Amorphicity, Melting point, End point and Glass transition temperature. This table can be used as evidence with the supplier to challenge the specifications of Batch Y22 which has a lower glass transition temperature and no measureable melting point.
So, by using the identiPol QA2, within 10-15 minutes of a new delivery, an operator can easily make a decision about the suitability of accepting and using the fresh material on the production line.
For most purposes, the simple PASS / FAIL approach of the Confirmation Mode of operating the identiPol QA2 is sufficient to justify the adoption of the system within the manufacturing environment. However, detailed reporting, statistical analysis and visualisation of the raw data are possible if further evaluation is required.