Instruments to which this note applies : Biocal 2000, Biocal 4000
Prepared by: Lars Wadsö
Target use: Research related to soil studies and characterization of soil samples, particularly glucose-‐amended samples
Introduction
토양은 무기 및 유기물 뿐만 아니라 박테리아, 아메바, 마이크로 진균과 같은 미생물,곤충, 벌레, 진드기 등의 동물 그리고 식물들로 아주 복잡하게 혼합되어있습니다. 이 때문에 토양을 모든 방면에서 여러 가지 방법으로 연구할 수 있습니다. 이 응용자료는 토양에서 생물학적 현상을 연구하기 위한 도구로 등온 열량 측정법을 사용하는 방법에 대해 설명합니다.
토양 연구를 위한 생물학적 측정 기술의 대략적인 구분은 구체적인 방법과 구체적이지않은 방법으로 나뉩니다. 현미경, PCR 또는 특정 물질의 농도를 측정하는 방법과 같은 구체적인 방법은 토양 샘플에 있는 유기물의 종류를 판단할수 있으며 대표적인 구체적이지않은 방법은 토양에 어떤 종류의 유기체 또는 화합물이 포함되어 있는지에 대한 세부 사항을 고려하지 않고 전체 샘플에 대한 호흡 속도 및 전체 유기 탄소등의 전반적인 매개 변수를 평가합니다. 등온 열량 측정법은 토양에서 발생하는 전체 열 생산량을 측하기 때문에 불특정한 방법으로 생물학적 활동의 척도로 사용할 수 있습니다.
Isothermal calorimetry
Isothermal calorimetry primarily measures the thermal power, or heat production rate P (units: W) samples of, for example, soil in small samples sizes of 1 – 100 g. The thermal power is a measure of the rate of the processes in the sample. If only one process is active, the rate of the process ν (mol s-1 or g s-1) is related to the thermal power by the enthalpy of the process ΔH (J mol-1 or J g-1) as:
![]()
Most soil processes are aerobic and are therefore best discussed per mol oxygen, considering that the enthalpy of oxidation (combustion) of all organic compounds have similar enthalpies of -455±15 kJ mol(O2)-1 [1]. This enthalpy – which is sometimes called Thornton’s constant [1] – is very useful in biological calorimetry on aerobic samples, as it gives a connection between respirometry and calorimetry. It must be expressed per mol oxygen consumed, which means that the rate is expressed in units of mol(O2) s-1. Note that Thornton’s constant is only valid for aerobic processes; anaerobic processes cannot be characterized on a “per mol(O2)”-basis.
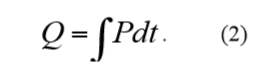
If a process is studied over time, the resulting heat produced is expressed as Q (units: J). Q is the integral of the thermal power P:
The heat is a measure of how far the processes in a sample have proceeded. Combining the above two equations:
![]()
Where Δn is the amount (mol) that has been consumed during the time period when the heat Q was determined. The heat thus has a direct connection to the extent of a process. For aerobic processes the heat can in many cases be seen as approximately proportional to the oxygen consumption rate (see reference [1] for a more detailed discussion of this).
General experimental notes for soil tested in an isothermal calorimeter
Standard soil science methodology should be used to prepare the samples. This can include:
-
Sieving of the soil to 2 or 4 mm to remove larger objects (rocks, worms etc.).
-
Not letting moist soils dry out.
-
Measuring the water holding capacity (WHC) and adjusting the water content to a certain fraction of the WHC (for example 60% of WHC).
-
Keeping the soil samples at the temperature of measurement to acclimatize them.
-
Use a proper number of replicates to assure statistical significance.
-
Keeping track of the oxygen and carbon dioxide concentrations in the sampl
Note that soil activity is very temperature dependent, and one has to decide whether to conduct an experiment at a natural soil temperature (which can be quite low in temperate climates) or at a standard temperature (such as 20 or 25 °C) to increase the thermal power and shorten the measurement time.
Glucose-amendment measurement
A common experimental procedure in soil science is to use addition of glucose to compare the biological activity of different soils. Isothermal calorimetry is an excellent technique to study this. Some examples of glucoseamendment studies used in calorimetric soil measurements are found in references [2; 3; 4; 5; 6].
In this application note, we show the result of two experiments made at 25 °C with 125 ml plastic vials in a Biocal 2000. Each experiment consisted of two simultaneous measurements, one of which was glucose-amended. The soil was a mixed garden soil that had been sieved (4 mm) and kept at room temperature for about 1 week before the measurements. The moisture content was not controlled.
with 50 g soil samples with and without glucose amendment
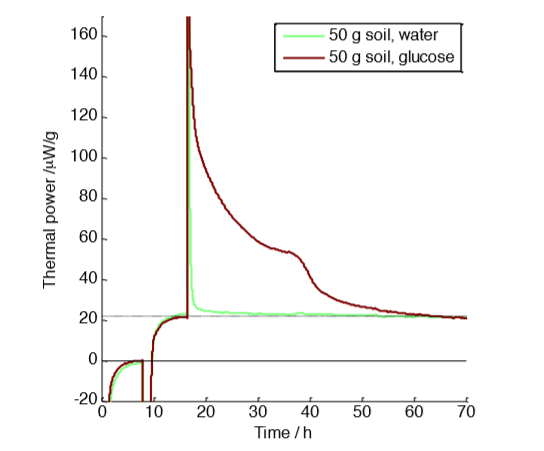
Figure 1 shows measurements made on 50 g soil samples. The measurement was made in three steps: first a baseline determination with vials containing water only (first 8 hours); secondly a measurement of the natural (unamended) soil samples (until approx. 18 hours); thirdly the response to glucose-amendment for the sample represented in the brown curve, and water addition for the sample in green. The glucose addition was 5 ml of 0.07 M glucose. In this measurement both the thermal power of the natural soil (about 22 µW g-1) and the effect of the glucose-amendment can be seen. The excess heat produced by the glucose-amendment was 4.3 J g-1, or 215 J for the whole 50 g sample, whereas the full combustion of the added glucose would have resulted in a total heat production of about 1000 J [2]. Assuming that the heat that is not produced is retained as biomass, we can infer an efficiency of almost 80%. However, note that efficiency can be defined in many different ways and the “heat efficiency” calculated above cannot generally be assumed to equal the carbon conversion efficiency (see reference [1] for a further discussion).
A potential issue to consider with the measurement in Fig. 1 is that the large sample consumed a significant fraction of the oxygen in the vial, and also produced a significant amount of carbon dioxide. A lack of oxygen or excess carbon dioxide may impact the reaction rate.
One use of Thornton’s constant mentioned earlier is to make estimates of the oxygen and carbon dioxide concentrations in calorimetric vials during measurements on aerobic samples. From the ideal gas law and knowing that air contains about 21% oxygen we can calculate that each ml of air contains 8.5 µmol oxygen, which can support the oxidative production of about 4 J of heat (from Thornton’s constant). In the measurement in Fig. 1 about 215 J was produced for the glucose-amended sample. The vial had a head-space of approx. 100 mL, which means it could support combustion of up to 400 J. About half the oxygen was thus consumed, which also means that the carbon dioxide concentration has increased from a negligible amount to approximately 10%. A higher carbon dioxide level is often more important for biological processes than the fact that the oxygen level goes down. Note that the above calculation was made using several simplifying assumptions, for example that oxygen and carbon dioxide are only present in the gas phase (significant amounts can also be dissolved in water in for example a soil), but it offers a good approximation for our purposes.
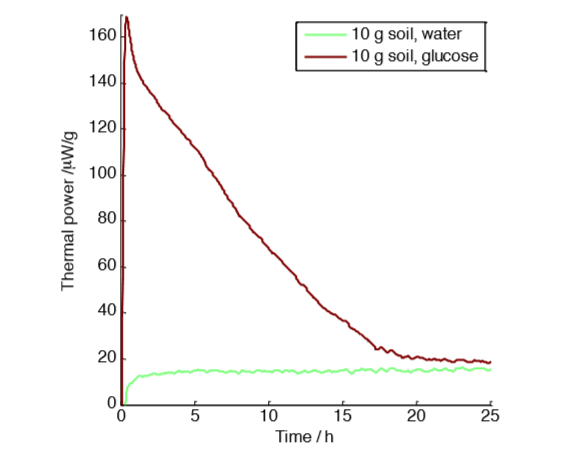
with 10 g soil samples with and without glucose amendment.
However, we conducted another experiment with smaller sample sizes to verify the assumption that the excess air in sample vials with 50 g samples was sufficient. Figure 2 shows a measurement on a five times smaller sample with a more favorable air-to-sample ratio. For this experiment, we only show the result of the injection of glucose and water.
The result is similar: 4.5 J g-1 of excess heat produced by the glucose amendment. We can therefore conclude that in this case the change in oxygen and carbon dioxide concentrations did not influence the result.
However, three differences can be noted between the experiments in Fig. 1 and Fig. 2: the glucose-‐amended curves have different shapes in the two measurements, the experiment in Fig. 1 takes longer time than the experiment in Fig. 2, and the measurements in Fig. 2 show more noise than in Fig. 1, which can be attributed to the smaller sample size.
Recommended sample size and vial size
We recommend the use of large sample vials (>100 ml) for soil testing, for two reasons:
-
As many soils produce relatively low thermal, larger samples (as the 50 g samples in Fig. 1) will produce results with a better signal-to-noise ratio for studies of natural soils, like the unamended samples in this application note
-
For glucose-amendment measurements, a smaller sample in a relatively large sample vial will ensure a higher head space volume to sample mass ratio (as in Fig. 2), which is useful to reduce the changes in gas composition. One could also achieve a good head space volume to sample mass ratio in a smaller vial simply by reducing the sample size. However, the generally inhomogeneous nature of soil calls for larger sample sizes to ensure that the specimen is representativ
Recommended base procedure for glucose-amended soil measurements
We recommend the following base procedure for glucoseamendment measurements (our assumption in this experiment was that 0.1 ml 0.07 M glucose solution is added to every 1 gram of soil, but other amounts and concentrations can be used):
-
Prepare a syringe with 1 ml 0.07 M glucose solution, and one syringe with 1 ml water.
-
Prepare two vials with 10 g soil in each vial.
-
Insert the vials into the calorimeter; also place the syringes inside the thermostat.
-
Press Start Logging.
-
Measure for at least 1h to get a measure of the basal (non-amended) activity.
-
Put on cotton gloves or other insulating gloves. Open the calorimeter, remove and open a vial, inject the glucose solution evenly in the sample (not only on the surface), close the vial and re-insert the sample into the calorimeter. Do the same for the other sample with the injection of water.
-
Continue measuring until the thermal power for the glucose amended soil stabilizes close pre-amendment values.
-
Check the gas concentrations (as discussed above) to verify that the changes in oxygen and carbon dioxide concentrations are not too high.
-
Calculate the heat produced with the amendment by integrating its thermal power, and subtracting the integrated thermal power of the unamended sample (This can be readily done in the Biocal software).
Note that the disturbance when the glucose solution is added is negligible, as all components are thermostated in the calorimeter before the addition is made. The glucose and water additions were also made quickly (<30 s) using cotton gloves and the vials were placed on a piece of insulating expanded polystyrene. Alternatively, the vial can be placed on a scale if the mass of solution added needs to be determined more accurately than can be made by a syringe.
References
[1] L Wadsö, L.D. Hansen, Calorespirometry of terrestrial organisms and ecosystems, Methods, (2014)
[2] J.A. Harris, K. Ritz, E. Coucheney, S.M. Grice, T.Z. Lerch, M. Pawlett, A.M. Herrmann, The thermodynamic efficiency of soil microbial communities subject to long-‐term stress is lower than those under conventional input regimes, Soil Biol. Biochem., 47 (2012) 149-157.
[3] T. Kimura, K. Takahashi, Calorimetric studies of soil microbes: quantitative relation between heat evolution during microbial degradation of glucose and changes in microbial activity in soil, J Gen Microbiol, 131 (1985) 3083-3089.
[4] K. Ljungholm, B. Noren, I. Wadsö, Microcalorimetric observations of microbial activity in normal and acidified soil, Oikos, 33 (1979) 24-30.
[5] M.E.S. Cabral, E.E. Sigstad, A new approach to determine soil microbial biomass by calorimetry, J. Thermal Anal. Calorim., 104 (2011) 23-29.
[6] N. Barros, S. Feijoo, L.D. Hansen, Calorimetric determination of metabolic heat, CO2 rates and the calorespirometric ratio of soil basal metabolism, Geoderma, 160 (2011) 542-547.
- Figure 2. Thermal power with 10 g soil samples with and without glucose amendment..png (34.21kB)
- Δn is the amount (mol) that has been consumed during the time period when the heat Q was determined.png (4.24kB)
- formula of thermal power rate (P).png (2.93kB)
- Figure 1. Thermal power with 50 g soil samples with and without glucose amendment.png (30.24kB)
- integral of the thermal power P (Q).png (4.42kB)
