

CureView is a Windows application that provides a user interface to LT-451
Dielectric Cure Monitor, LTF-631 High Speed Dielectric Cure Monitor and LTP-350 MicroPress.
- Cure state.
- Bulk resistance.
- Capacitance
- Resistivity (ion viscosity)
- Conductivity
- Permittivity
- Design and maintain test procedures.
- Acquire and plot test data in real time.
- Analyze and maintain test results.
-Import and analyze past results data.
- Control the temperature of the MicroPress.
|
|
|
The LT-451 and LTF-631 dielectric cure monitors measure the dielectric response of Material Under Test (MUT) between the electrodes of a sensor, which can be used to determine the bulk resistance and capacitance for the MUT. The corresponding fundamental material properties are resistivity (or its inverse, conductivity) and permittivity. Of particular interest is the resistivity--also known as ion viscosity--because of its relationship to physical viscosity. Often differing by only a scaling factor, resistivity and physical viscosity relate to the cure state of polymeric materials such as epoxies, polyurethanes, polystyrenes, bulk molding compound (BMC) and sheet molding compound (SMC). The measurement of resistivity with dielectric sensors requires no mechanical components, and yet provides quantitative information about a mechanical property.
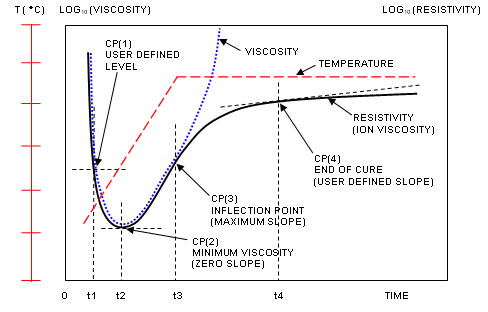
A material cures due to the crosslinking of monomers, and often this reaction is exothermic - generating heat - or is driven by the heat of a press or oven. Typically the viscosity initially decreases as the temperature increases and the material responds by simply melting and becoming more fluid. Resistivity also decreases as mobile ions experience less resistance to flow. The curing reaction is slow at the beginning, but eventually accelerates with greater temperature and then dominates the system. Viscosity reaches a minimum--a point of zero slope--and then increases as the material becomes more rigid and hardens. Resistivity similarly undergoes a minimum and then increases due to greater impediment to the flow of ions through the growing network. Eventually the reaction slows and the viscosity becomes infinitely large. At this point the behavior of resistivity departs from that of viscosity and continues to change, but more and more slowly, signaling the end of cure. The physical viscosity and electrical resistivity typically follow curves like those in the figure below.
Viscosity and resistivity in a curing material
The dielectric cure curve is characterized by four Critical Points:
CP(1) -A user defined level of ion viscosity that is typically used to identify the onset of material flow at the beginning of cure.
CP(2) - Ion viscosity minimum, which typically also corresponds to the physical viscosity minimum. This Critical Point indicates the time when the crosslinking reaction and resulting increasing viscosity begins to dominate the decreasing viscosity due to melting.
CP(3) - Inflection point, which identifies the time when the crosslinking reaction begins to slow. CP(3) is often used as a signpost that can be associated with gelation.
CP(4) - A user defined slope that can define the end of cure. The decreasing slope corresponds to the decreasing reaction rate. Note that dielectric cure monitoring continues to reveal changes in the evolving material past the point when mechanical measurement of viscosity is not possible.
By acquiring and recording dielectric data, CureView enables the study of formulation, reaction rate, temperature response, viscosity and more during the curing process. This information can be readily transferred and compared among research and development (R&D), quality assurance (QA) and quality control (QC), and manufacturing.