Instruments to which this note applies: I-Cal Flex, Biocal
Prepared by : Lars Wadsö
Target use: oil oxidation, rancidity
Introduction
기름의 산화는 일반적으로 산소와 관련된 화학적 반응입니다. 사람이 기름을 사용하는 경우 산소로 인해 산패가 발생하고 이취가 나지만 페인트에 기름을 사용하는 것처럼 다른 응용분야에서는 산화가 페인트의 경화를 초래하게 됩니다.
모든 기름은 산화상태에 있고 완전히 멈출수 없지만 기름의 종류, 온도, 빛 그리고 천연 및 합성 산화 방지제와 미량의 금속 이온과 같이 작은 성분의 농도에 의해 속도가 결정됩니다[1]. 기름의 산화 과정은 주로 과산화수소(과산화물의 농도)와 같은 반응 생성물의 농도를 측정하여 연구됩니다[2].
산화과정에는 상당한 열이 생성되므로 등온 열량 측정법은 이러한 공정을 조사하는데 적합합니다. 몇몇 비슷한 연구들이 발표되었고 Dridi et al. [3]은 application note에서 볼 수 있는 결과와 비슷하게 나왔습니다.
Materials and methods
Three different oils were used
- O1 - Raw linseed oil for human consumption
- O2 - Rapeseed oil for human consumption
- O3 - Raw linseed oil for paint production
All samples had the same mass of 3 g of oil.
The measurements were made at 70°C in an I-Cal Flex isothermal calorimeter with samples placed in 20 mL PE-HD vials. The calorimeters had been calibrated electrically and baselines had been measured with empty vials before the measurement. A Tian correction with calculated time constants was applied, but did not change the result significantly, which is attributable to the fact that the oxidation processes are rather slow (Note: for an explanation of the Tian correction, see Application Note AN-G01).
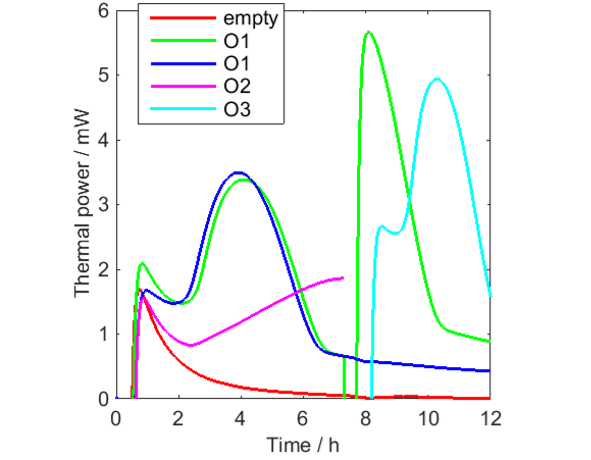
The following measurements were made (see Fig. 1):
- Empty vial (0-12 h).
- O1 (0-12h – green curve). This sample was aerated at 7 h.
the aeration was made by taking up the vial out of the calorimeter, opening the lid and letting the headspace be refreshed with air, closing the lid and putting the vial down in the calorimeter again.
- O1 (0-12 h – blue curve).
- O2 (0-7 h).
- O3 (7-12 h).
Results and discussion
Figure 1 shows the results. It is seen that significant amounts of heat are produced by all oils, and that O2 seems to be the least reactive, which is expected as rapeseed oil is a nondrying oil, while raw linseed oil is a drying oil (although not at all as reactive as so called boiled linseed oil, which is used in paints).
In Fig. 1 it is clearly seen that the signal from the empty vial takes a long time to reach the baseline. This is a true thermal power produced in the vial. Most probably it is oxidation/crystallization?? of the polyethylene polymer in the vial and it is a process that takes place in all PE-HD of the used brand when they are heated to 70 °C for the first time. If cooled to room temperature and heated a second time, this heat is not seen (not shown). So, although PE-HD vials can be used up to XX °C, they are not as inert as for example glass vials, which may be preferable to use at higher temperatures.
From Fig. 1 it is seen that all curves except the green curve after aeration shows similar initial minima that may be the result of each of these measurements being the sum of the decreasing signal from the vials and increasing signals from the oil samples. This has been tested in Fig. 2, in which the vial signal has been subtracted from the first three oil samples. Although this data correction should not be seen as perfect, for example as only one empty vial was used, the result indicates that the thermal power from the oil oxidation initially increases from low values.
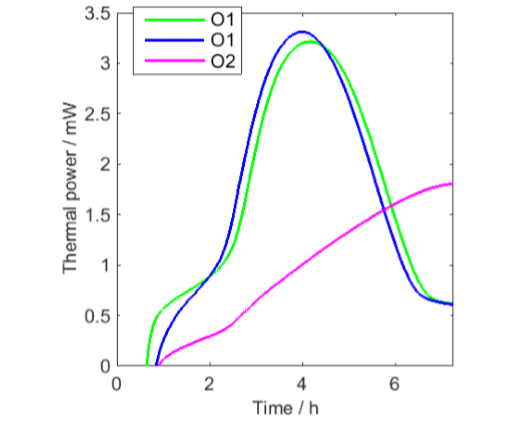
PE-HD vial has been subtracted
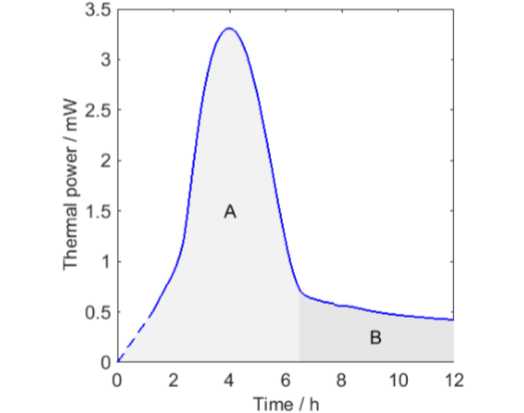
All curves except the one for O2 decreases to lower values after a peak in thermal power. This is most probably an effect of oxygen limitations. To investigate this in a little more detail I have redrawn the longest measurement in Fig. 3 with two modifications:
-
I have assumed that the thermal power during the first hour was linearly increasing from zero.
-
I have indicated that the whole measurement could be seen as being composed of two parts.
The integrals of the two part A and B are 39 and 13 J, respectively. This can be compared with the 80 J produced when all the oxygen in a 20 mL vial is consumed (calculated using the ideal gas law and the enthalpy of oxidation of -455 kJ/mol(O2)). As the sample is small, the head-space oxygen can this support almost 80 J, but part A only produces half of this before the thermal powers drop rapidly to low values. A possible explanation for this is that the first part (A) is the autocatalytic consumption of oxygen already in the oil that is initiated by the increase in temperature, and the second part (B) is the continued consumption of oxygen that diffuses into the oil from the head-space.
References
-
Chen, B., D.J. McClements, and E.A. Decker, Minor components in food oils: a critical review of their roles on lipid oxidation chemistry in bulk oils and emulsions. Crit. Rev. Food Sci. Nutrition, 2011 51 10 901-916.
-
Halvorsen, B.L. and R. Blomhoff, Determination of lipid oxidation products in vegetable oils and marine omega-3 supplements. Food Nutr. Res., 2011 55.
-
Dridi, W., J. Toutain, A. Sommier, W. Essafi, M. Gargouri, F. Leal-Calderon, and M. Cansell, Characterization of lipid oxidation in plant oils by micro-calorimetry. Food Chem., 2016 197 709-713.
