*ARC의 반응속도 분석 대한 자세한 수학적 설명은 THT Technical Information Sheet No. 20에 나와 있습니다. 여기서는 ARC 데이터의 반응속도 측면에 대한 일반적인 이론을 설명합니다.
모든 반응의 동역학(kinetics)는 Arrhenius equation을 기반으로 다음을 설명합니다.
- 반응 속도,
- 온도에 따른 가속화 및
- 농도가 고갈됨에 따른 반응속도 감소
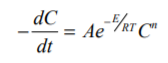
Where A is the pre-exponential factor, E the activation energy and n the order of reaction.
Only when a fully adiabatic experiment is performed can the assumption be made that
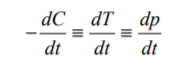
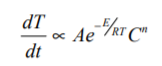
As the concentration is depleted so heat is produced and the rates are equivalent Thus
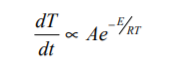
Or for a zero order reaction
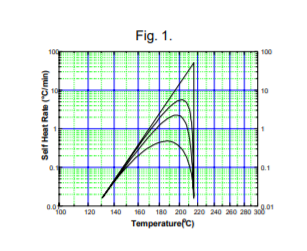
Plotting reaction data for reactions obeying Arrhenius Kinetics should show curves as in Fig. 1.
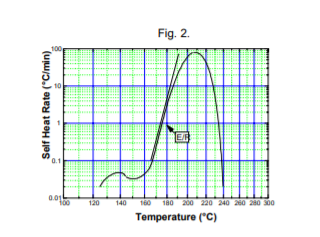
The slopes of the initial part of the self-heat rate curve (or all the curve for a zero order reaction) is E/R and thus the activation energy is readily obtained. The curvature of the self-heat rate plot is indicative of the order of reaction. After some experience a fair idea of activation energy can be obtained simply by visual inspection, Fig. 2, even if the reaction is not simple .
The Accelerating Rate Calorimeter data analysis software has routines built in to determine zero order (worst case) activation energy from portions of self-heat rate curves. By kinetics modeling the activation energy, order of reaction and pre-exponential factor can be determined if a complete set of data showing 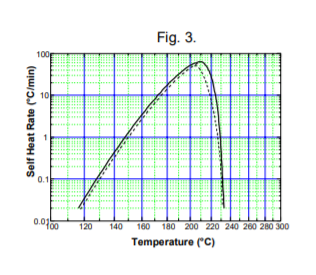 a simple, single mechanism is available, Fig. 3.
There is also the possibility of determining kinetics parameters for autocatalytic reactions. Such a reaction has a self-heat rate curve as shown in Fig. 4.

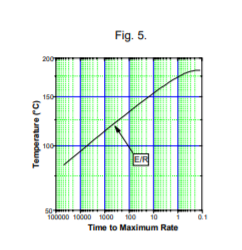
But it may be that this shape curve occurs for a other reasons: endotherm prior to exotherm, loss of inhibitor or build up of accelerator, as well as the classic autocatalysis mechanism. Ideally kinetics analysis should only be carried out on simple reactions showing a single mechanism, but often in practice "numbers" are demanded from complex data, indicating multiple overlapping reactions. This is usually carried out empirically by selecting Arrhenius portions of data, but this should be done only with great care. Other methods, outside the scope of this technical information sheet can reliably do this. These methods involve use of more sophisticated software, eg the Thermal Safety Software from Cheminform Ltd Whilst kinetic analysis is usually carried out with self-heat rate data, the slope of the Time to Maximum Rate curve also yields the activation energy, Fig. 5.
Assuming pressure is generated, the pressure generation rate is itself equivalent to rate of loss of concentration for a single mechanism reaction and therefore this data can also be used. A key aspect of interpreting accelerating rate calorimetry data is to know how far to proceed in the analysis of test data. As much information as possible should be obtained but unless the validity of kinetic numbers is properly understood it is not just undesirable but dangerous to over interpret the data in this way To get Accelerating Rate Calorimeter data that will allow kinetic analysis it is necessary to perform the test with significant sample mass. But if there is a reaction mechanism change to give spontaneous exothermic reactions with rates 100°C/min or higher, the instrument time constant and heat transfer through the sample will have a significant role and cause significant error. Though this may be perceived as a problem, data obtained from such fast reactions is often of no real importance since the time that passes at such rates is so little that it can be considered to be zero.
Reference:
ARC Technical Information Sheet No. 9, Thermal Hazard Technology, UK

검색 결과 31건
- 분류 : 가속속도열량계
하기