Unless control is regained, a runaway reaction will often go to explosion with devastating results. The reaction proceeds with rate increasing exponentially with temperature. This is described by the well-known Arrhenius Equation:
For potential runaway reactions of any reactive chemical or system, it is vital to know, at every temperature, the time before explosion. A feature of the Accelerating Rate Calorimeter is its ability to determine directly the time to explosion or maximum rate of the material under investigation. The time to maximum rate must not be confused with the temperature of no return.
Time to Maximum Rate
The time to maximum rate is the time period available prior to the incident from any specific temperature in the worst case. A knowledge time to maximum rate at all temperatures therefore allows alarm temperatures to be set, and time available for remedial measures or for evacuation. The time to maximum rate measured determined by accelerating rate calorimetry gives the time available at all temperatures under the worst case, fully adiabatic, conditions.
The time to maximum rate is usually written tmr.
Temperature of No Return
The temperature of no return is a temperature above which it is not possible to control a reaction or material in the vessel in which it is contained. The temperature of no returned is therefore dependent on the vessel size and shape and the ambient environment. The temperature of no return is usually written Tnr.
Application
Whilst the Accelerating Rate Calorimeter determines the tmr directly by experiment, it is possible to determine tmr by calculation knowing the kinetics of the reaction, but
this may lead to significant errors.
The time to maximum rate is of great value in the area of thermal hazards evaluation. In this Technical Information Sheet the time to maximum rate plot obtained from the
Accelerating Rate Calorimeter is discussed together with the uses of time to maximum rate data and the potential problems that can often occur if the time to maximum rate is obtained indirectly.
The self-heat rate curve from Di-tertiary butyl peroxide, DTBP shows the reaction commencing below 120°C and the rate continues to increase with temperature until near 200°C.
See Fig.1 overleaf.
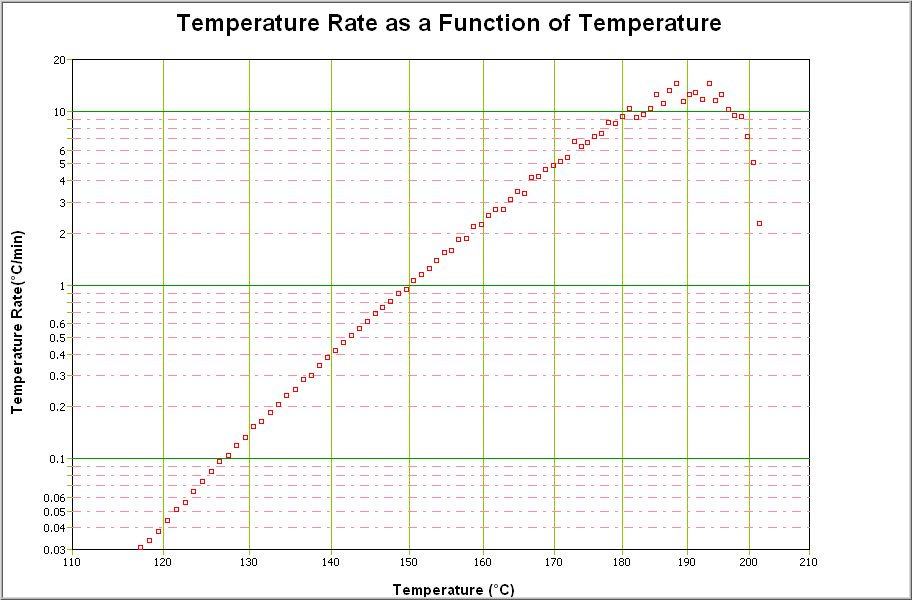
Once the temperature nears 200°C the amount of DTBP remaining is little and thus the rate decreases until finally the exothermic reaction is complete. There is of course a point where the self- heat rate is a maximum. This can be seen easily here but in a more complex reaction with overlapping peaks the maximum self- heat rate may have to be carefully defined.
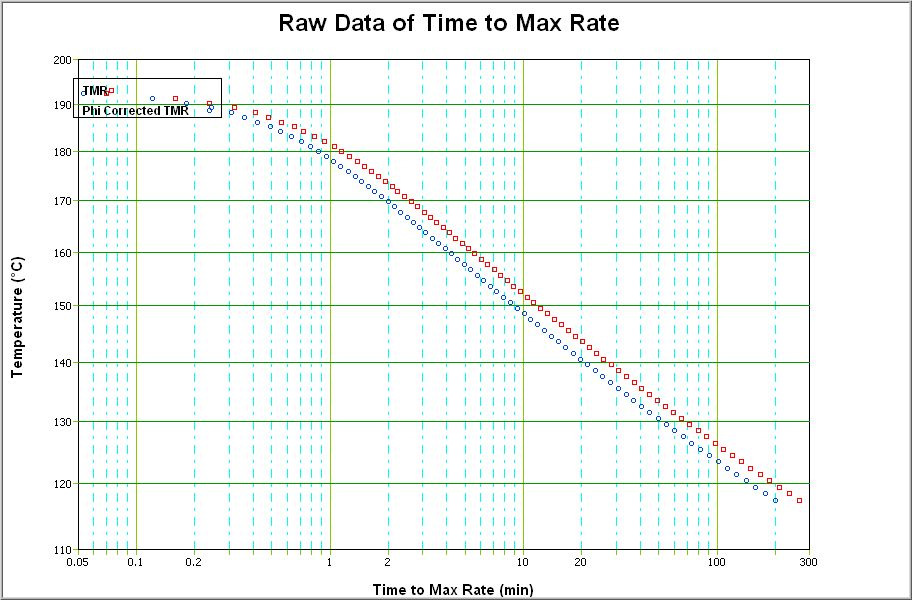
At the temperature where the maximum selfheat rate occurs, the time to get to this temperature, the time to maximum rate is zero. At all lower temperatures there will be a specific 'time to maximum rate'. The first dated point will have the longest time to maximum rate. Therefore it is possible to plot Temperatures against Times to Maximum Rate. This is shown in Fig. 2. Often on this plot are two tmr curves, one of raw data and one corrected for heat lost into the bomb Fig. 2. For more information on this φ correction see Technical Information Sheet No 22.
Because this time to maximum rate plot has been obtained directly in an adiabatic test that has simulated runway reaction, it is possible to directly apply the data. At every data point it is possible to know the actual worst case, time to maximum rate or explosion.
But it may be necessary to extrapolate to lower temperatures to get an estimation of time to maximum rate from a temperature of interest. This must be done with caution from the raw data or it may be done if the kinetics are evaluated from the modelled kinetic reaction.
Extrapolation of tmr plots of multiple, complex or autocatalytic data sets are difficult because there is not a straight line part of the curve at lower temperatures. In these cases, only the worst case extrapolation should be considered. The worst case extrapolation being the one that gives the shortest times at any selected temperature.
It can be seen from the data in Fig. 1 that if the temperature was 70°C the time to maximum rate would be very long indeed. There may be no need to take immediate action, the time to maximum rate plot is a worst case scenario and in real life there would also be heat loss from the vessel. Thus the true time available should be longer. If control
is lost from 100°C, there would be a period of a few hours before the explosion occurred. In a processing situation this may be a long time, but in a storage situation this is a short time. Therefore the interpretation of the time to maximum rate information must be carried out with an understanding of the process and the vessel.
If control was lost from 120°C, the time to explosion would be shorter and the data may suggest that this or 140°C may be the temperatures to set alarms for remedial measure and evacuation. Clearly if control was lost and the temperature observed to be 160°C there would be no time for corrective action, get out quick!
Indirect determination of time to maximum rate
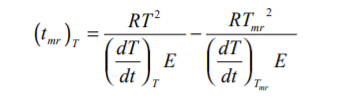
If the kinetics of an exothermic reaction can be obtained, the time to maximum rate can be calculated. From integration of the Arrhenius Equation and applying adiabatic kinetics equations (see THT Technical Information Sheet No 20), the time to maximum rate has been described as
When the reaction has low activation energy with this can be approximated thus
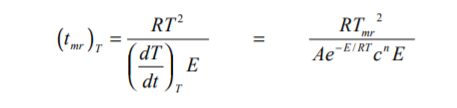
Caution should be applied to such calculated results. In the equation, errors in A will have a linear effect, errors in n are not likely but errors in E are likely and have a significant effect.
Plotting data calculated from a hypothetical kinetic description of a reaction with a chosen activation energy and with values of E at +10% and -10% of the chosen value also plotted, the variation in time to maximum rate with activation energy is shown in Fig. 3.
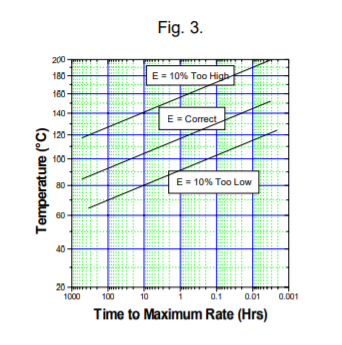 Fig. 3 should be read horizontally! For example at 100°C, the true tmr may be 20 hours, perhaps a safe margin in a processing situations. But if the activation was measured 10% too high, 100°C would indicate 100 days and it would be considered that at this temperature the reaction is proceeding were too slowly for processing. Here 140°C is equivalent to 20 hours (but at 140°C the real situation is 10 minutes from explosion).
Alternatively if the activation energy was determined 10% too low, at 100°C only 10 minutes to explosion would be indicated and this would then suggest that a temperature near 60°C is best for processing. And errors of 10% or more in the activation energy are common and thus the use of one calculation of time to maximum rate must be done very carefully indeed.
Interpretation of the time to maximum rate data in either way is usually a worst case interpretation. But there will be heat loss from the vessel. The time to maximum rate data may be applied directly if information on vessels is known to give maximum safe temperatures or size, this is discussed in THT Technical Information Sheet No. 5.
Reference:
ARC Technical Information Sheet No. 4, Thermal Hazard Technology, UK

검색 결과 31건
- 분류 : 가속속도열량계
하기