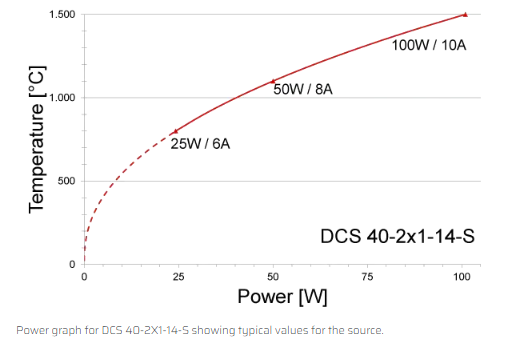
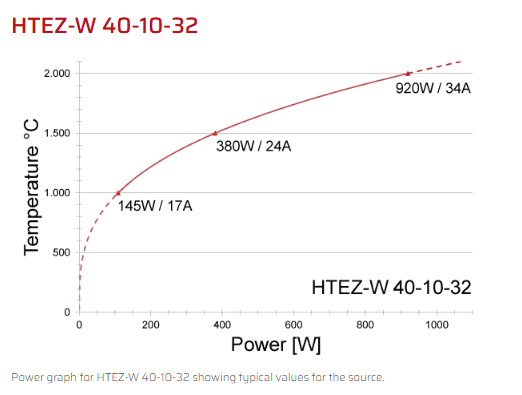
Power Graphs
The power graphs show temperature ranges of different cell types as a function of the power consumption. They give information about the reasonable dimensioning of required power supplies.
Power graphs give information, e.g. about the reasonable dimensioning of required power supplies.
The power graphs below show temperature ranges of different cell types as a function of the power consumption. They are typical examples gained under standard test chamber conditions. Especially the low temperature range is very much dependent on chamber layout, arrangement of sources within the chamber and cooling conditions.
Because of different lengths and customized options every single cell is getting tested in our lab and is equipped with its individual power data.
The thermocouples were placed at the bottom of the crucibles for each filament type:
- standard filament SF
- cold lip filament CL
- hot lip filament HL
- dual filament
Its values are diagramed in a red line.
An additional thermocouple was placed next to the top filament near the orifice of the crucible for dual filament DF type. Its values are diagramed in an orange line.
For sources not listed on this site please contact us for power graph information.
DCS 40-2X1-14-S