Conductance change during cure
During thermoset cure the conductance G MUT between the electrodes of a sensor changes by several orders of magnitude. Before processing starts, conductance is normally low because the material is either solid or at a temperature too low for significant polymerization. Typically the thermoset is cured by heating to an elevated temperature. As the material becomes warm and softens, the conductance increases. The rate of reaction increases with temperature, also, and at some point its influence dominates and the material becomes more viscous—conductance reaches a maximum at this time then decreases as the material becomes rubbery then rigid. By the end of cure the conductance may have decreased by a factor of 100 or more from its peak value.
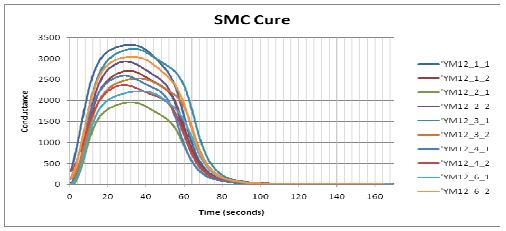
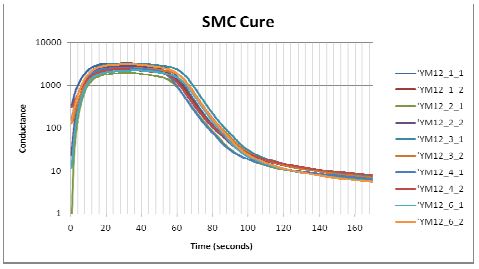
SMC conductance during cure, on a linear scale
Data plotted on linear scales
Figure 5-1 shows how conductance varied during cures of several samples from the same batch of sheet molding compound (SMC). The data are plotted against a linear scale and reveal considerable sample to sample variation, with a 140% difference between the maximum and minimum values of peak conductance. At first glance the lack of consistency casts doubt about the usefulness of dielectric cure monitoring; however, to avoid misinterpretation, it is necessary to understand the factors that determine conductance.
Figure 5-2 shows a model of the conductance and capacitance of a material under test (MUT) between parallel plate electrodes. Note that only conductance is relevant in this section.
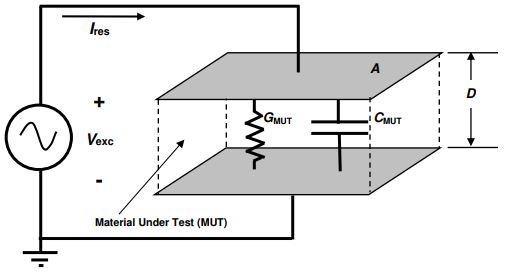
Electrical model of dielectric material Under Test
Conductance and conductivity
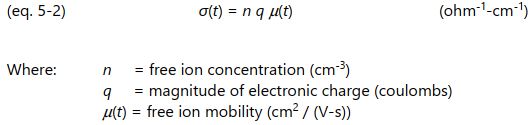
Conductance is a bulk property that depends on the amount of Material Under Test, the geometry of the electrodes and the conductivity of the material between them. Like density, conductivity is a property that is independent of the quantity of material and how it is measured. During cure this conductivity changes with time, and the measured bulk conductance as a function of time, G MUT ( t ), is given by equation 5-1.
Several factors determine the time varying conductivity, which is given by equation 5-2.
Assuming the free ion concentration and the charge of the free ions do not change during cure, then only the change in free ion mobility, µ ( t ), affects conductivity and ultimately conductance. In a thermoset, perhaps the most significant factor determining mobility is the polymerization of monomers. As molecular chain length or crosslink density increase, the growing network impedes the flow of ions and reduces their mobility.
Combining equations 5-1 and 5-2 produces the following expression:

In reality, the value of [ n ( A/D ) q ] may change from sample to sample and test to test. The free ion concentration, n , increases with conductive additives and decreases with non-conductive filler. The geometry ( A/D ) of the electrodes may differ from sensor to sensor because of variations in fabrication or set up. The free ion charge normally does not change but is included with the terms in brackets for simplicity. Equation 5-3 may then be reduced to:

Here B = n ( A/D ) q , the variable terms unrelated to curing. Expressed logarithmically, equation 5-4 becomes:

From equation 5-5, plotting the measured conductance on a logarithmic scale captures the entire range of G MUT ( t ) caused by the mobility, which can change by several orders of magnitude during cure. Plotting on a logarithmic scale also produces an offset, which is log 10 ( B ), caused by the terms unrelated to curing. If the free ion concentration and the electrode geometry are constant for a particular sample and test, then the result is a constant offset from the baseline behavior of log 10 ( µ ( t )).
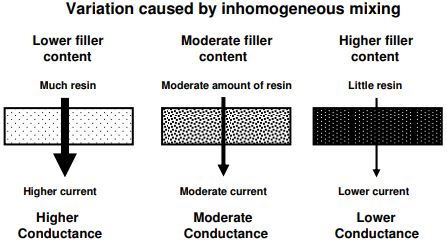
Addtion of non-conductive filler reduces amount of conductive resin
Effect of mixing and fillers
For a single batch of liquid resin, good mixing can produce a homogeneous free ion concentration, and the measured conductance can be uniform from sample to sample. In contrast, a material like SMC has a high content of non-conductive chopped glass fibers mixed with polyester, vinyl ester or epoxy resin. This composite is semi-solid, is difficult to mix well, and as a result different samples may have different ratios of fiber to resin. The measured conductance of SMC is therefore likely to vary among samples from a single batch, as illustrated in Figure 5-3.
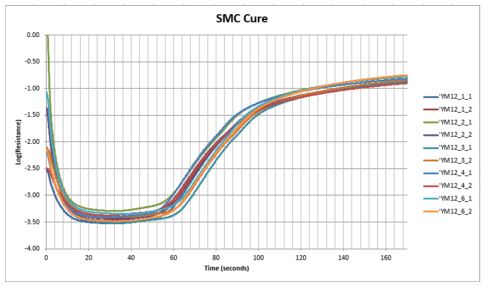
Data plotted on logarithmic scales
When the data of Figure 5-1 are plotted on the logarithmic scale, the curves are largely parallel to one another and differ by an offset in conductance. This offset is typically caused by sample-to-sample variation in filler content, which does not affect the cure rate.
SMC conductance during cure, on a logarithmic scale
Plotting conductance on a logarithmic scale has significant advantages compared to a linear scale:
- The entire range of conductance is visible
- Only factors that affect cure determine the shape of the curve
- Factors that do not affect cure, such as variations in filler content or sensor
Consequently, using a logarithmic scale is the optimum method for seeing all information available from dielectric cure monitoring. Conductance, however, is not typically used to study thermoset cure. Resistance is the reciprocal of conductance and measuring the material property of frequency independent resistivity—ion viscosity—is more conventional.
By representing the SMC cure of Figure 5-4 as resistance, Figure 5-5 shows resistive behavior is simply the inverse of conductive behavior. At the beginning of processing, resistance is normally high because the material is either solid or at a temperature too low for significant polymerization. As temperature increases, the material softens and resistance decreases. The rate of reaction increases with temperature and at some point its influence dominates and the material becomes more viscous—resistance reaches a minimum at this time then increases as the material becomes rubbery then rigid. By the end of cure the resistance may have increased by several orders of magnitude from its minimum value.
SMC resistance during cure, on a logarithmic scale
As with conductance, resistance plotted on a logarithmic scale reveals the progress of cure in the shape of the curve. Factors unrelated to cure, such as differences in background ion concentration or sensor geometry, cause offsets in the curve.
The two most common sensor configurations are the parallel plate and the planar interdigitated electrode, both depicted in Figure 5-6.
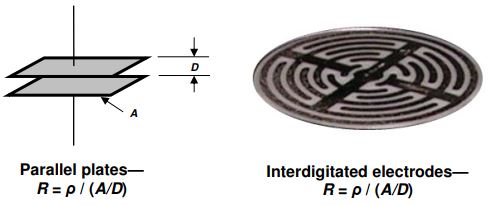
Parallel plate and interdigitated electrode geometries
The bulk property of resistance ( R ) is related to the material property of resistivity ( ρ ) by a scaling factor or cell constant. For the parallel plate configuration of Figure 5-2 this scaling factor is the ratio of plate area A to plate distance D , or A/D . For planar interdigitated electrodes, this scaling factor is still called the A/D ratio even though area and distance are not as apparent. As with conductivity, resistivity changes with time during cure, and the measured bulk resistance as a function of time, R MUT (t), is given by equation 5-6.
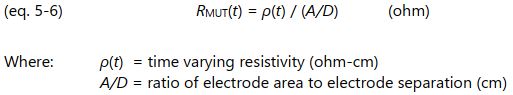
The goal of dielectric cure monitoring is to reduce measurement of this resistance to the material property of resistivity, to produce data that are independent of sensor geometry.
Reference :
Lambient TechnologiesTM Application Note 3.05—Linear vs. Logarithmic Scales : Seeing All the Information, All Page
상세한 사항은 아래 첨부된 자료를 참고 부탁 드립니다.
