Conductivity and resistivity in materials
Dielectric cure monitoring measures the bulk conductance and capacitance of a Material Under Test (MUT), which are used to calculate the material properties of conductivity and permittivity.
Conductivity ( σ ) has both frequency independent ( σ DC ) and frequency dependent ( σ AC ) components. In an oscillating electric field, σ DC arises from the flow of mobile ions while σ AC arises from the rotation of stationary dipoles. These two responses act like electrical elements in parallel and add together to produce the total conductivity:

Resistivity ( ρ ) is the inverse of conductivity as shown below:

Like conductivity, resistivity has both frequency independent ( ρ DC ) and frequency dependent ( ρ AC ) components. Of particular interest for cure monitoring is the frequency independent resistivity, ρ DC, because of its relationship to mechanical viscosity. Before gelation, the amount of polymerization affects both mechanical viscosity and the movement of ions, and therefore influences ρ DC . For convenience, unless otherwise indicated, this chapter will use the term frequency independent resistivity to refer to ρ DC . Similarly, the term viscosity will refer to mechanical viscosity.
Viscosity and resistivity
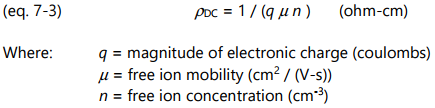
Viscosity is a measure of how easily the molecules of a fluid move past one other in response to shear forces, and in the case of polymeric materials is determined by the motion of polymer chain segments. In contrast, resistivity is a measure of the mobility of free ions through a medium under the influence of an electric field. Frequency independent resistivity ( ρ DC ) is given by equation 7-3.
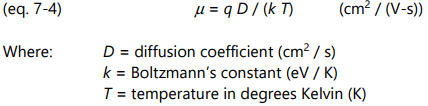
Mobility determines the rate of ionic diffusion through a medium, and is given by the Einstein relationship of equation 7-4:
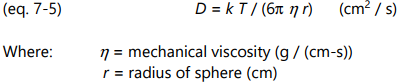
If mobile ions are modeled as spherical particles, then in the limit of low Reynold’s numbers, the diffusion coefficient, D, is given by the Stokes-Einstein relation of equation 7-5:
Combining equations 7-3, 7-4 and 7-5 yields the following relationship between frequency independent resistivity and viscosity:

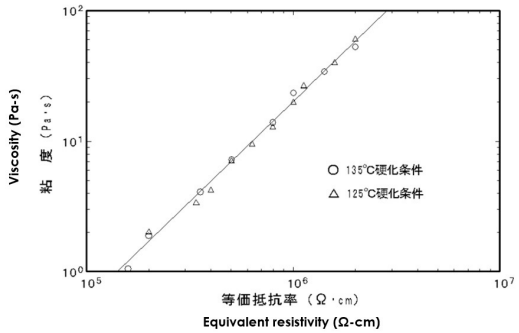
Consequently, frequency independent resistivity is proportional to viscosity. To emphasize this relationship, the term ion viscosity ( IV ) was coined as a synonym for frequency independent resistivity and is defined as:

Often differing by only a scaling factor, the change in ion viscosity and the change in mechanical viscosity are related to the cure state of thermosets and composites. The electrical measurement of ion viscosity requires no mechanical components, yet provides information about a mechanical property. Empirical results show the proportionality of equation 7-6 is valid in many cases, although for poorly understood reasons some systems obey a power law:

Simultaneous measurements of viscosity and ion viscosity
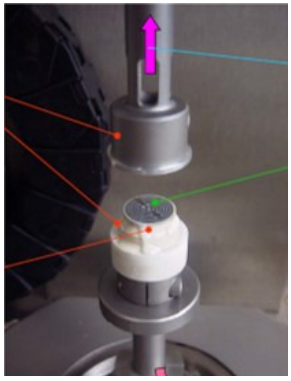
Simultaneous DMA-DEA apparatus
Simultaneous measurements of viscosity and ion viscosity are possible with combined dynamic mechanical analysis (DMA) and dielectric cure monitoring (DEA) equipment, such as in Figure 7-1. Results of DMA-DEA testing with this particular apparatus are plotted in Figure 7-2, showing the correlation between viscosity and ion viscosity for this particular epoxy. A similar simultaneous test used a rheometer to monitor viscosity during the cure of another epoxy. Viscosity was measured with a Rheological Dynamic Spectrometer and ion viscosity was measured with a Micromet Instruments Eumetric III Microdielectrometer. The two curves in Figure 7-1 Figure 7-3 show strong correlation Simultaneous DMA-DEA apparatus from the beginning of cure up to gelation at about 135 minutes. After the gel point, viscosity increases rapidly and becomes immeasurable. Ion viscosity, however, continues to provide information and after gelation is often proportional to the change in modulus. As a result, DEA can follow material state through the entire cure.
Viscosity and resistivity (ion viscosity) for
simultaneous DMA-DEA measurement during cure of an epoxy
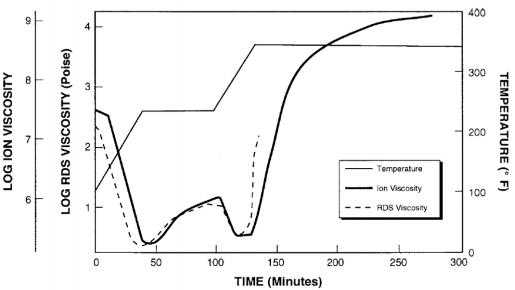
Viscosity and ion viscosity during cure of an epoxy
Critical Points during thermoset cure

Figure 7-4
Typical ion viscosity behavior of thermoset cure during thermal ramp and hold
A thermoset cures when monomers react to form polymer chains then a network. The reaction is usually exothermic—generating heat—and may additionally be driven by the heat of a press or oven. A plot of log( ion viscosity ) is a simple way to characterize the progress of cure and Figure 7-4 shows the behavior of a typical thermoset with one ramp and hold step in temperature. At first as temperature increases, the material softens or melts and mechanical viscosity decreases. Mobile ions also experience less resistance to movement and ion viscosity decreases. At this point the reaction is still slow.
As the material becomes hotter, the cure rate increases. At some time the accelerating reaction begins to dominate; mechanical viscosity reaches a minimum then the material becomes more viscous. Electrically, the increase in ion viscosity due to polymerization overcomes the decrease in ion viscosity due to higher temperature. Ion viscosity also reaches a minimum then increases due to chain extension, which presents a greater and greater impediment to the flow of ions.
Ion viscosity curve and slope of ion viscosity of thermoset cure
during thermal ramp and hold
After the minimum point, ion viscosity increases continuously until the concentration of unreacted monomers diminishes and the reaction rate decreases. Consequently, the slope of ion viscosity also decreases and eventually reaches a value of zero when cure has stopped completely.
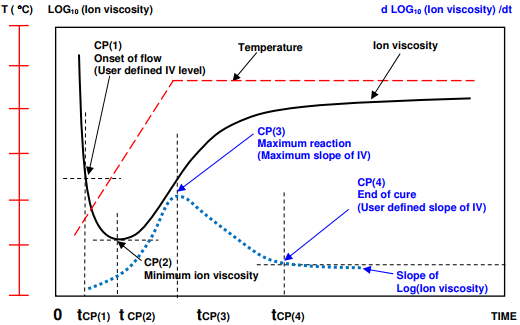
As shown in Figure 7-5, four Critical Points characterize the dielectric cure curve:
- CP(1)—A user defined level of log(IV) to identify the onset of material flow.
- CP(2)—Minimum ion viscosity, which closely corresponds to minimum mechanical viscosity, indicating when polymerization and increasing viscosity begin to dominate the material’s behavior.
- CP(3)—Maximum slope , which identifies the time of maximum reaction rate. The height of CP(3) is a relative measure of the reaction rate and CP(3) is often used as a signpost associated with gelation.
- CP(4)—A user defined slope that can define the end of cure. The decreasing slope corresponds to the decreasing reaction rate.
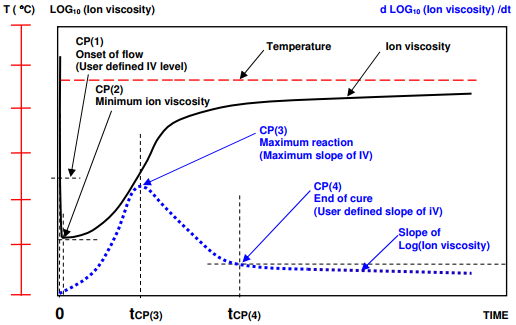
Figure 7-6
Ion viscosity curve and slope of ion viscosity of thermoset cure during isothermal processing
Figures 7-4 and 7-5 illustrate the typical behavior of curing thermosets when temperature gradually ramps to a hold value. The response is slightly different when the material under test is essentially isothermal, as shown in Figure 7-6.
In this case CP(1) either is meaningless or occurs immediately after the application of heat, when material flows and contacts the sensor. Minimum ion viscosity also occurs at t = 0 or shortly afterwards because cure begins immediately. For isothermal cures, CP(3) and CP(4) are conceptually the same as for ramp and hold conditions.
Correlation of ion viscosity with other properties
In addition to mechanical viscosity, other properties also depend on the degree of polymerization or crosslinking and it is useful to investigate their relationship to ion viscosity. Figures 7-7, 7-8 and 7-9 show published data correlating viscosity, glass transition temperature and sound speed with ion viscosity or its reciprocal, conductivity. Each of these cases demonstrates how electrical measurements can probe material or cure state.
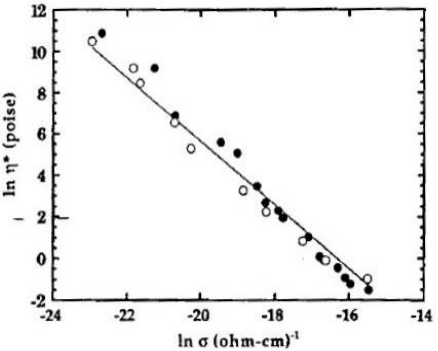
Viscosity vs. conductivity (ion viscosity = 1/conductivity)
for an epoxy
Every material is different and users should always confirm correlations of ion viscosity with other properties. Nevertheless, dielectric cure monitoring (DEA) joins other thermal analysis techniques like differential scanning calorimetry (DSC) and dynamic mechanical analysis (DMA) as a valuable tool for studying curing thermosets and composites.
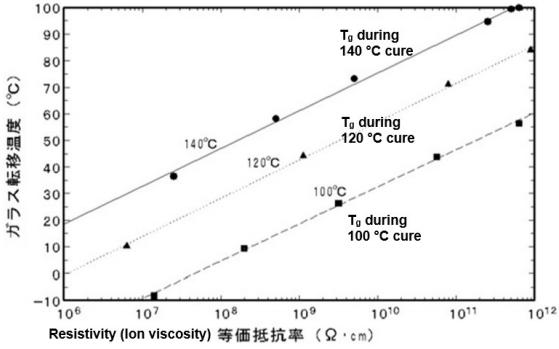
Glass transition temperature vs. resistivity (ion viscosity) for an epoxy
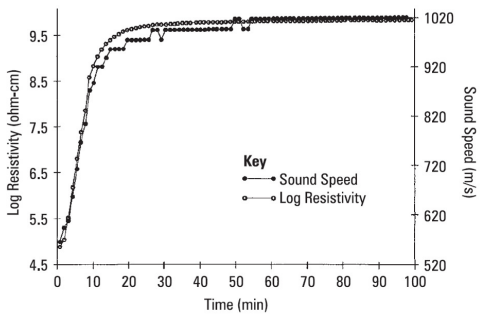
Resistivity (ion viscosity) vs. sound speed for a curing epoxy-fiberglass prepreg
Reference :
Lambient TechnologiesTM Application Note 3.07—Viscosity, Ion Viscosity and Critical Points , All Page
상세한 사항은 아래 첨부된 자료를 참고 부탁 드립니다.
- 14.PNG (44.78kB)
- 7.PNG (4.00kB)
- 10.PNG (34.07kB)
- 2.PNG (3.53kB)
- 11.PNG (44.48kB)
- 8.PNG (5.59kB)
- 15.PNG (61.58kB)
- 3.PNG (17.83kB)
- 1.PNG (3.89kB)
- 9.PNG (173.95kB)
- 13.PNG (44.86kB)
- 17.PNG (52.97kB)
- 6.PNG (6.65kB)
- 4.PNG (17.51kB)
- 12.PNG (43.62kB)
- 16.PNG (78.86kB)
- 5.PNG (13.04kB)
- 04. Viscosity+Ion+Viscosity+and+Critical+Points.pdf (445.26kB)
